In tremendously broad terms, being successful in your vulnerability research endeavours relies on understanding how user controlled input causes an application to behave. In a simple application, depending on your code reading abilities, you may be able to just read the code and understand precisely what happens to the input and where a potential vulnerability is located. However, most software we actually care about is unfortunately not that simple and so simply reading the code, what we call "static" analysis, can leave us scratching our heads in many cases. Not only that, but as a researcher you will inevitably encounter things you are simply unfamiliar with, such as a standard library function you have never used before
As a result, debugging is a critical task in vulnerability research, whether you’re inspecting a potential 0day or analyzing a known vulnerability. When we talk about debugging in the context of reverse engineering, we aren't talking about the entire process of finding (and resolving) bugs as you would in a software development environment. When I use the word "debugging" I'm really talking about interactive debugging.
Debugging allows us to stop the program at a specific spot in the code, or when a certain condition is satisfied, and look at the current state of just about everything in the context of the program. However, debugging is not always straightforward in the context of a research target, and in general using a debugger is not always entirely intuitive if you're not used to it.
With all that being said, these posts have two primary goals: providing instructions for setting up debug environments for a variety of situations, and a basic tutorial for each of the debuggers I use in these environments, which will include any handy features I tend to use. In addition, I will always try to tie things back to the categorizations I went through in my previous post
Since this post was getting so large, I've had to split it into multiple posts. But I'd like people to be able to have a single post as a reference, so here is a nice (planned) outline with links to the relevant posts (as I finish them).
Outline
- Basic debugging concepts
- Binary targets
- Debugging Windows targets with WinDbg
- Linux (and similar)
- gdb basics
- Kernel and Remote debugging
- Special cases with "virtual appliances"
- Fun with Ghidra's decompiler and Ghidra2Dwarf
- Java targets
- Eclipse basics
- Debugging with decompiled code
- Remote debugging
- .NET
- Visual Studio?
- Debugging with decompiled code
- Remote debugging?
- PHP targets
- XDebug setup
- Eclipse PHP basics
- Python targets
- Using PyCharm
- Using Visual Studio Code
Basic debugging concepts
At a high level debugging is not complicated. There's a small number of terms and most debuggers are incredibly similar in terms of how they function within this "model".
Breakpoints
One of the most important things we do with a debugger is setting "breakpoints". These are essentially markers that tell the debugger "whenever we reach this point in the code, pause and let me get to work". Depending on the debugging situation and the debugger, you may set a breakpoint at the start of a particular function and in some cases you can even set breakpoints when the program accesses a particular area of memory or when a particular condition is satisfied (known as a conditional breakpoint).
When the program pauses execution at a breakpoint, you can generally inspect the entire "state" of the program at that exact moment in time, like hitting pause on a video and inspecting every little detail of that exact frame. You can look at the value of variables or memory, and you can also see a high level view of the path the program took to get to your breakpoint, known as the call stack.
Call stack
The call stack is essentially a snapshot of all the in progress function calls that led to where the program currently is. For example, let's say we called a function foo() that calls another function bar(), and bar() calls a function baz(), which happens to be the function we've set our breakpoint in. In this situation our call stack looks something like this:
baz()<--- currently here
|__bar()
|____foo()
When baz() finishes executing, the program will continue along in bar() from where baz() was called, and the same thing will happen with foo() once bar() finishes executing.
Debuggers will also generally tell you the next "line" of code that will execute in the function for each call in the stack. In the context of the example above, let's say baz() gets called in 3 different locations inside bar(). You can figure out which one of those 3 locations baz() was called from by looking at where bar() is currently in its execution.
Controlling program execution flow
Once we're at a breakpoint and we've had a good look around at the current state of the program, we can directly control the flow of the program by "stepping". This allows us to go through the program in a controlled manner in order to observe every little change from every line of code. Most debuggers have (at least) three types of stepping: step in, step over, and step out.
Step in means you will enter any new function called and continue stepping from within that newly called function. Essentially, if you need to see what a called function does, or you don’t want to miss any line of code or instruction, you should use step in.
Sometimes you know exactly what a called function does, like in the case of a built in or standard function, or you don’t care what it does because it doesn’t involve any data you care about and you just want to skip over it. This is where step over comes in to play. You may be executing large chunks of code or instructions when you use this, but it will save you a ton of time when you use it correctly.
Finally, step out immediately gets you out of the current function to the next instruction in the calling function. I personally like to use this as sort of an “escape” from the current function. Maybe you stepped in to a function and then realized you don’t need to be stepping through the function so just hit step out and problem solved!
And that’s basically it! Specific debuggers have all sorts of additional features but being familiar with the above concepts means you can pick up basically any debugger and have a general understanding of what’s going on. With that being said, let’s dive right in to debugging binary targets.
Binary targets
When working with binary targets in the context of vulnerability research, you’re either going to be working purely in assembly or, in the case of a compiled open source program, with source code. For Windows targets we’re going to focus entirely on debugging assembly, and for Linux targets we’ll cover both due to the open source nature of the entire Linux ecosystem.
For everything in assembly, we’re going to be working with x64. However, if you’re not that familiar with assembly, don’t worry! The entire point of this is to learn about the tools which will enable you to become more familiar with assembly and over time as you spend more time debugging programs you will gain a better understanding of what’s going on. We’ll dive much deeper on the specific knowledge for researching binary targets in future posts.
To kick things off, let’s look at debugging Windows binaries with the official debugger from Microsoft, WinDbg.
Debugging Windows targets with WinDbg
WinDbg is available as part of the Windows SDK which you can grab here. If you’re running Windows 10, you can also grab WinDbg Preview (which I highly recommend) from the Microsoft Store. I’ll use standard WinDbg for the basic tutorial but switch to WinDbg Preview to have a look at the amazing Time Travel Debugging feature.
Without further ado, let’s dive right in and have a look at the basics of WinDbg.
WinDbg basics
First off, if you’d like to check out the official documentation for WinDbg, you can find it here
When you open WinDbg for the first time, at most you’ll see a floating command window and nothing else. This is less than ideal so let’s take a bit of time to go through the windows you’re likely to need and how to lay them out.
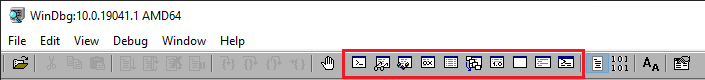
From left to right, the above icons correspond to:
- Command window
- Watch (global variables)
- Locals (local variables)
- Registers
- Memory
- Call Stack
- Disassembly
- Scratch pad
- Processes and threads
- Command browser
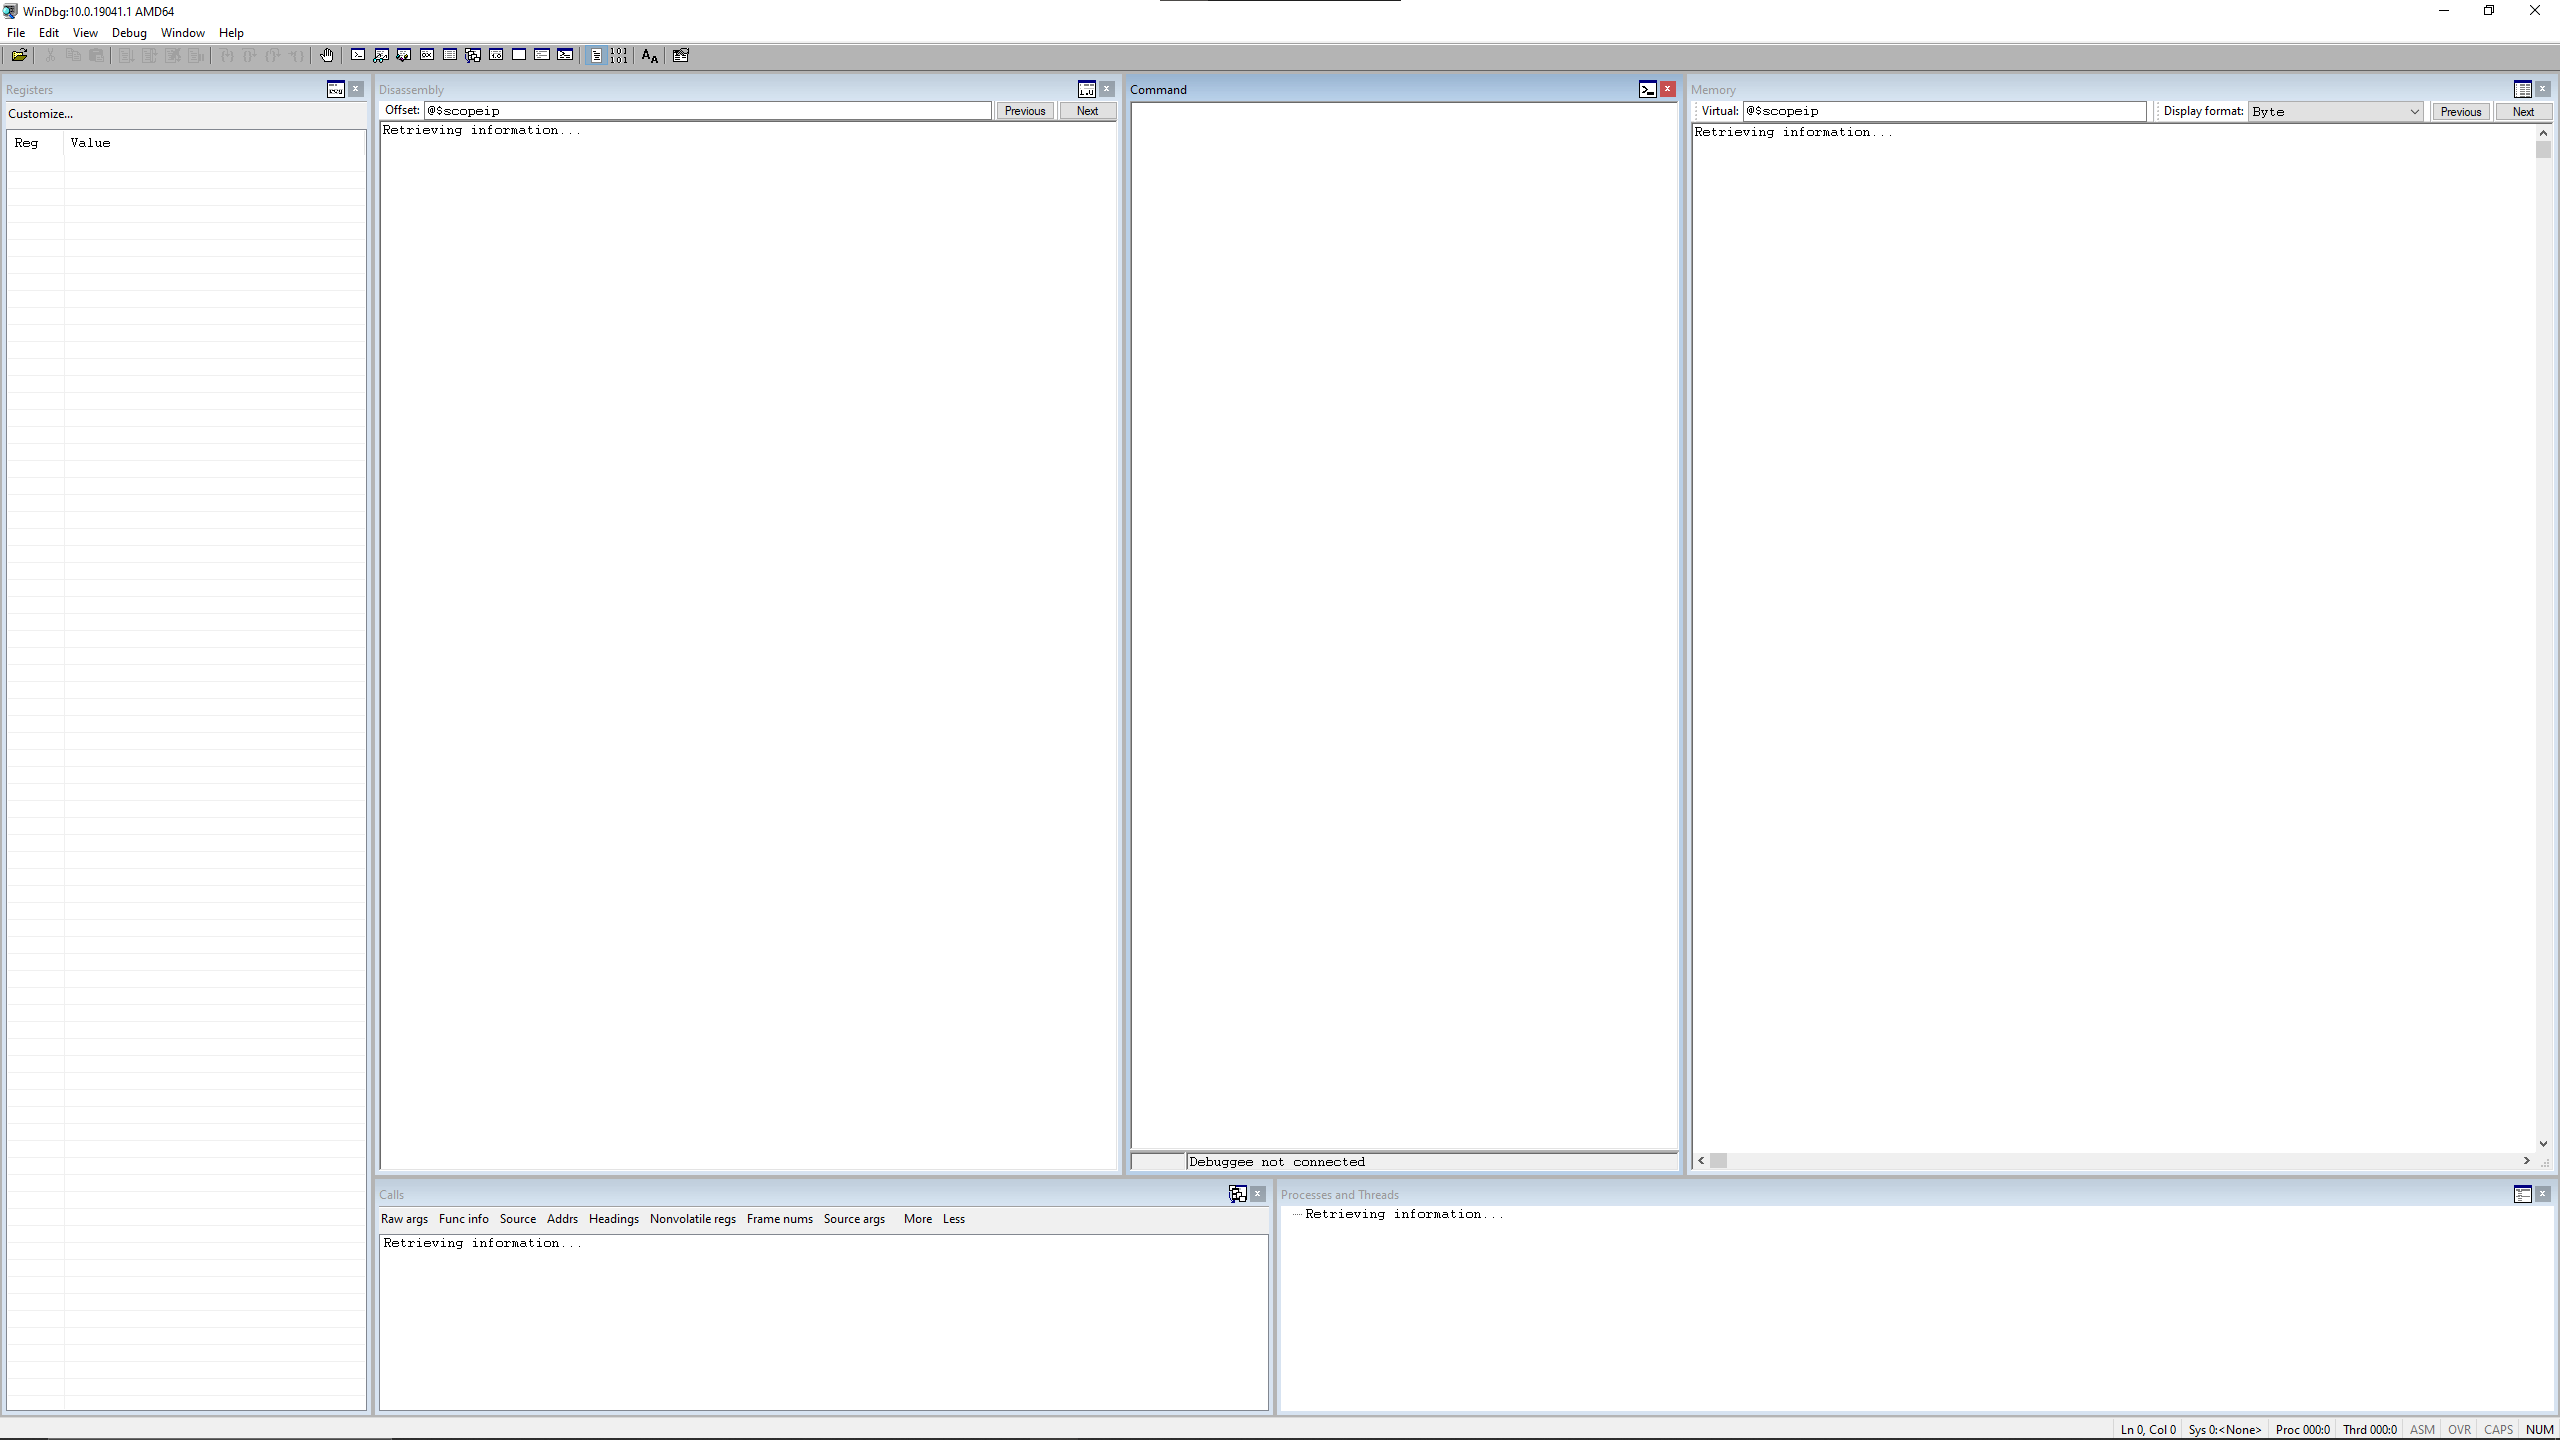
Each of the windows can be opened with alt-# shortcuts starting with alt-1 for the command window. The windows that are generally critical for reversing work I’ve bolded in the above. WinDbg lets you have each window floating freely, or you can also arrange the windows into "docks" where you can snap multiple windows into whatever arrangement you prefer. The main window is a dock by default, but you can open additional docks if you so desire. Everyone has their own preferences but I tend to just arrange my stuff in the main window dock so I can have my other monitor(s) free for reference purposes. This is generally my preferred layout these days:
One thing to note is that you will probably want to go to File/Save Workspace and/or Save Workspace to File to save your layout. If you save it to a file, you can easily transfer it to different systems and easily import it.
Now that we have the basic UI stuff out of the way, let's dive right in to debugging a target. We're first going to work with an actual Windows component for one big reason; we get debugging symbols for almost all Windows components automatically from Microsoft's Symbol Server! This makes setting breakpoints super easy and quite often we at least have a basic understanding of what a function might do based on the name. We're going to learn some of the basics by looking at a few of the base functions related to LNK file parsing in Windows.
Before we start, here's a small warning; we are going to be attaching our debugger to explorer.exe. This means that any time the debugger is "stopped", whether it's due to hitting a breakpoint or because you've just attached the debugger, most of the Windows shell will be unresponsive. This means you won't really be able to switch windows or do much of anything except work with WinDbg while execution is paused in any way. I would highly suggest you do this in a virtual machine or at the very least, be aware that things will "freeze" if WinDbg hits a breakpoint, so make sure that window is always visible 😀. You can grab a Windows Developer VM directly from Microsoft then install the SDK on it: https://developer.microsoft.com/en-us/windows/downloads/virtual-machines/
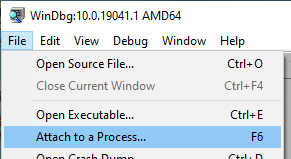
Ok, let's get started! First, open WinDbg (x64) if you haven't already then go to File/Attach to a Process...
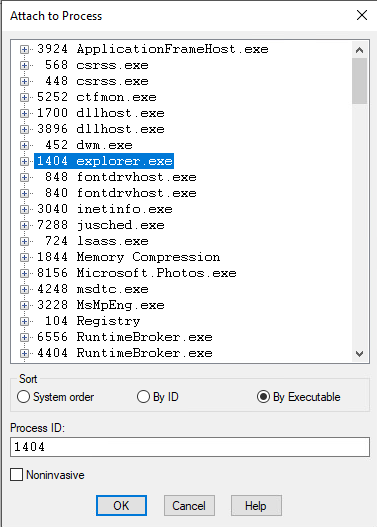
Now locate explorer.exe in the Window that pops up (usually easiest to sort by executable) select it, and click OK.
Now you'll see something like this:
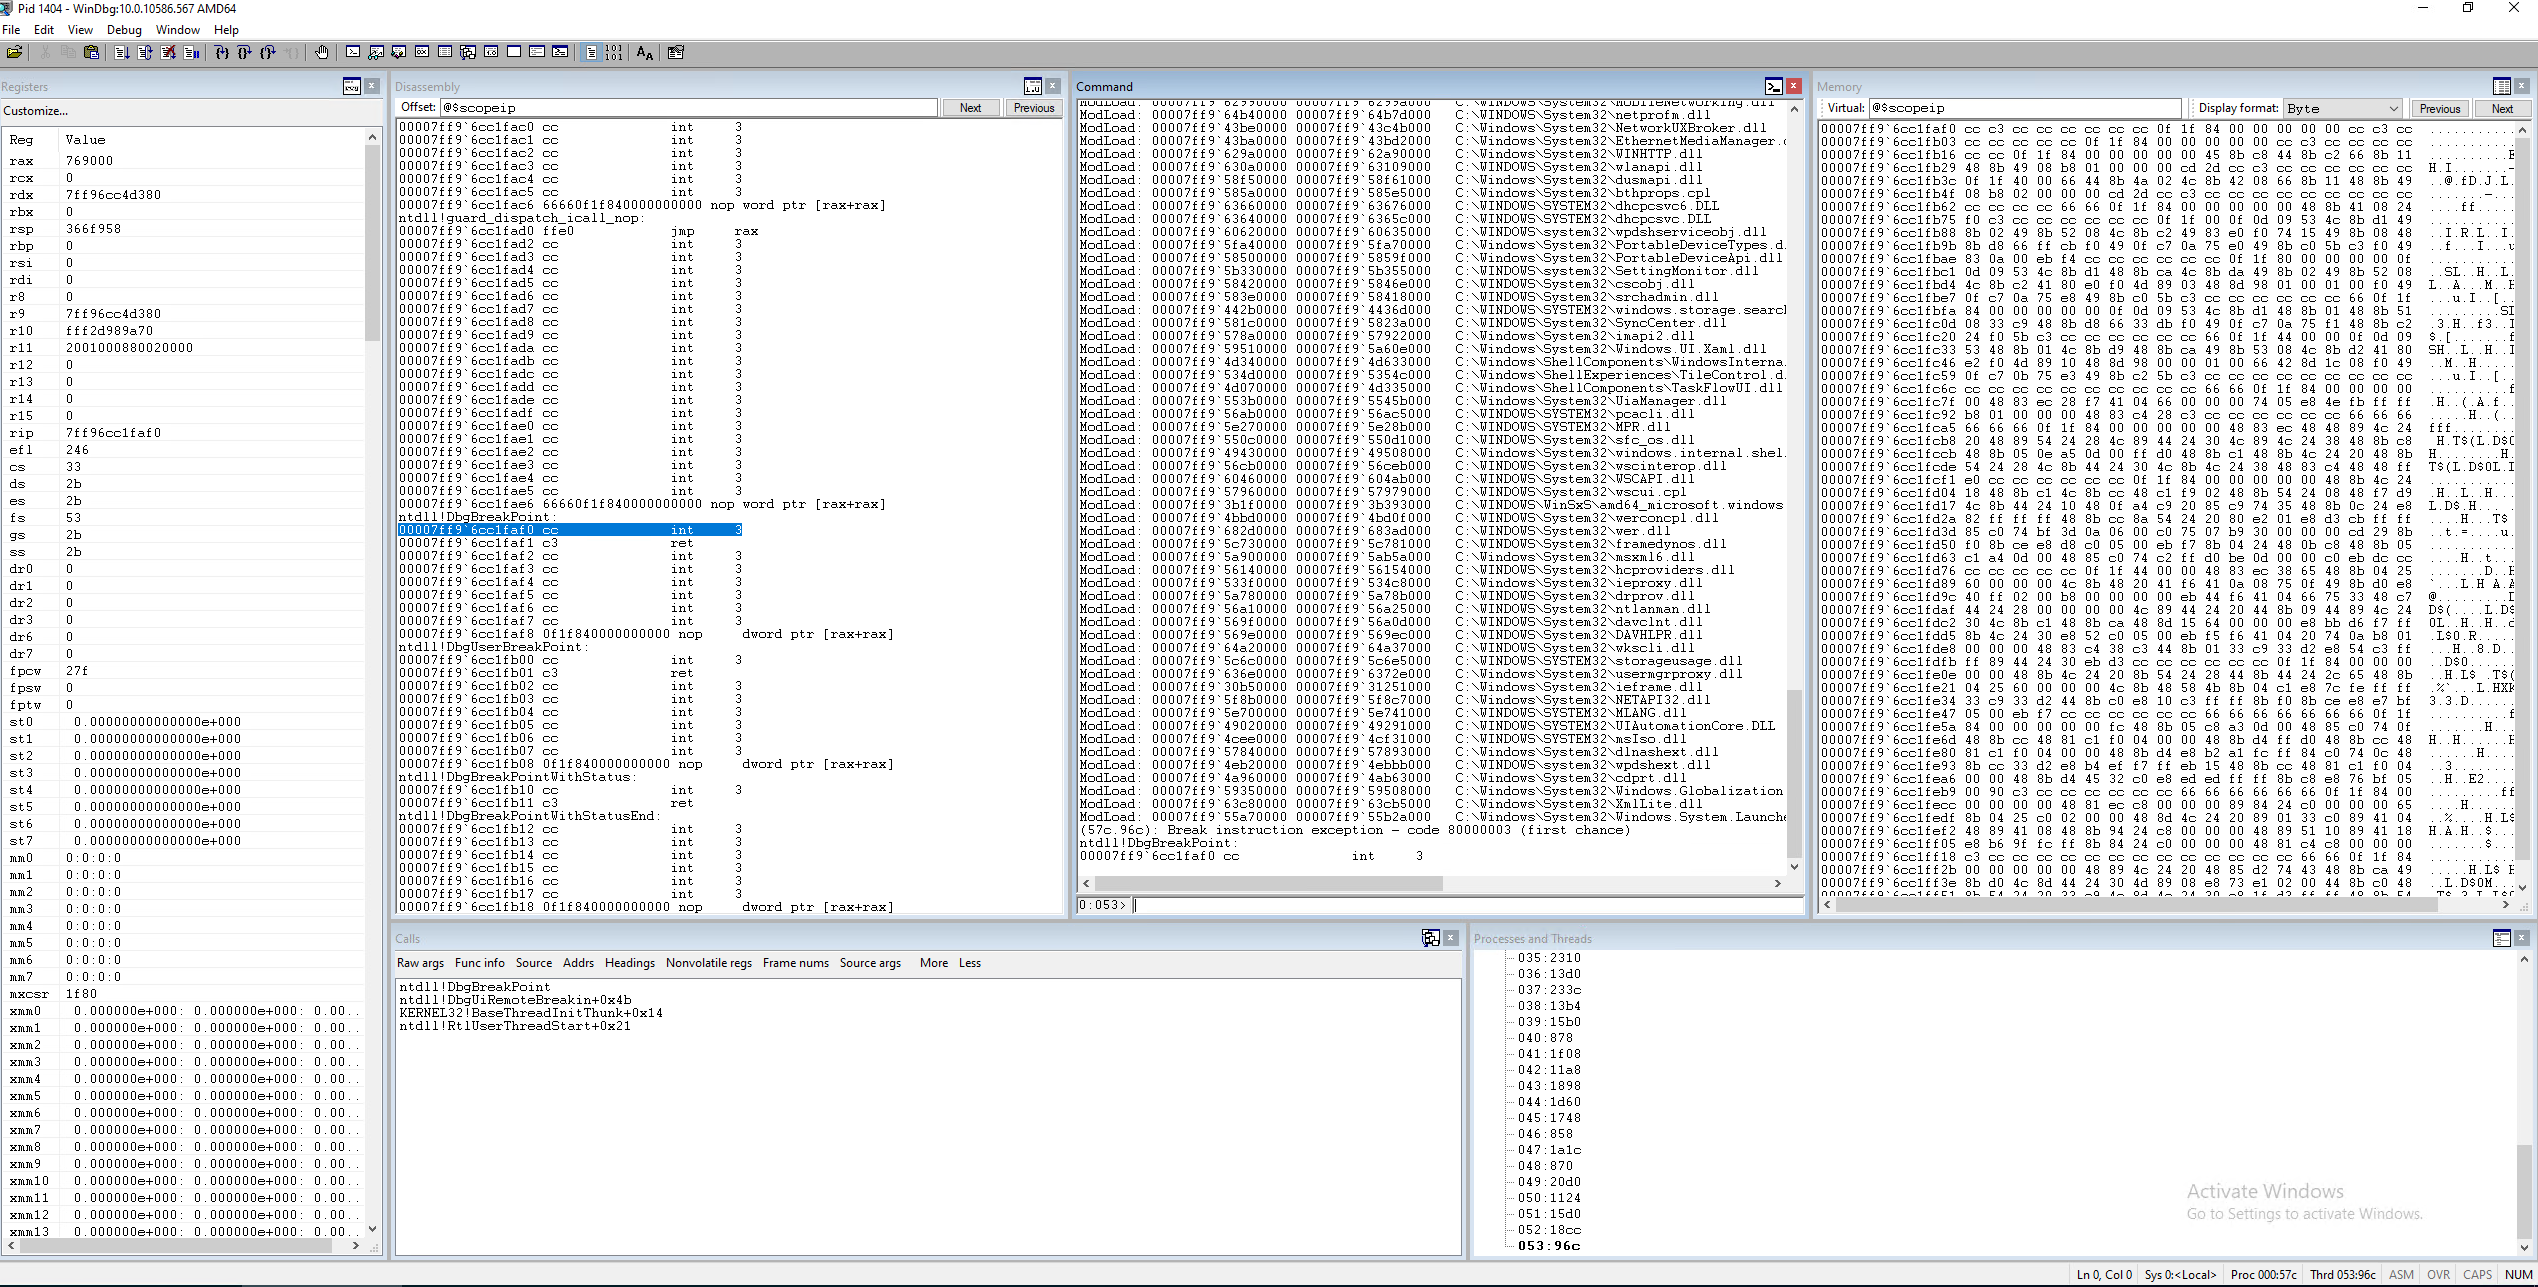
Each time execution is paused, whether it's due to hitting a breakpoint or because you were stepping through instructions, you'll get a "snapshot" of the entire context of the program you're debugging. At the core, this really means the current state of the program's registers and memory. By default, the Disassembly and Memory windows will point to an address identified by the $scopeip "pseudo-register". Basically this just means that the disassembly window will follow the current instruction, in the program, which is obviously useful, but so will the Memory window, which is not terribly useful. For now, we'll just leave the Memory window alone.
Basic breakpoints
Let's try setting our first breakpoint. We're going to set a breakpoint on one of the main functions responsible for starting to parse a LNK file, CShellLink::Load(). This function is located in Windows.Storage.dll on Windows 10, but if you're running an older version of Windows it might be in shell32.dll. But wait a second, aren't we debugging explorer.exe? Well we can reference loaded "modules", DLLs generally, by prefixing the function name with <module name>!. So in this case, we will refer to CShellLink::Load() with windows_storage!CShellLink::Load noting that the "." in the name of the DLL is replaced with an underscore, and we leave out the ".dll" as well.
To set a breakpoint, you'll type the following in the command window:
bp windows_storage!CShellLink::Load
The first time WinDbg needs debugging information about a particular executable (modules included) it will attempt to locate the appropriate PDB file on Microsoft's public symbol server and download it, so you may see *BUSY* beside the command window for a bit while the appropriate symbol files are downloaded. It's also important to note that the symbol files are unique to each exact version of a file, so when a file is updated WinDbg will need to grab the latest symbol file. Once your breakpoint is set, you can see the current list of breakpoints with bl.

Each item in the breakpoint list has a numeric identifier (starting with 0), and a status (enabled or disabled), as well as some other info. If you're curious about what all those other things are, check out the bl documentation: https://docs.microsoft.com/en-us/windows-hardware/drivers/debugger/bl--breakpoint-list-
To disable a breakpoint without deleting it, use bd # where # is the breakpoint number. You can re-enable it with (surprise, surprise!) be #, and you can completely remove (clear) the breakpoint with bc #. You can also use wildcards to do this on all your breakpoints.
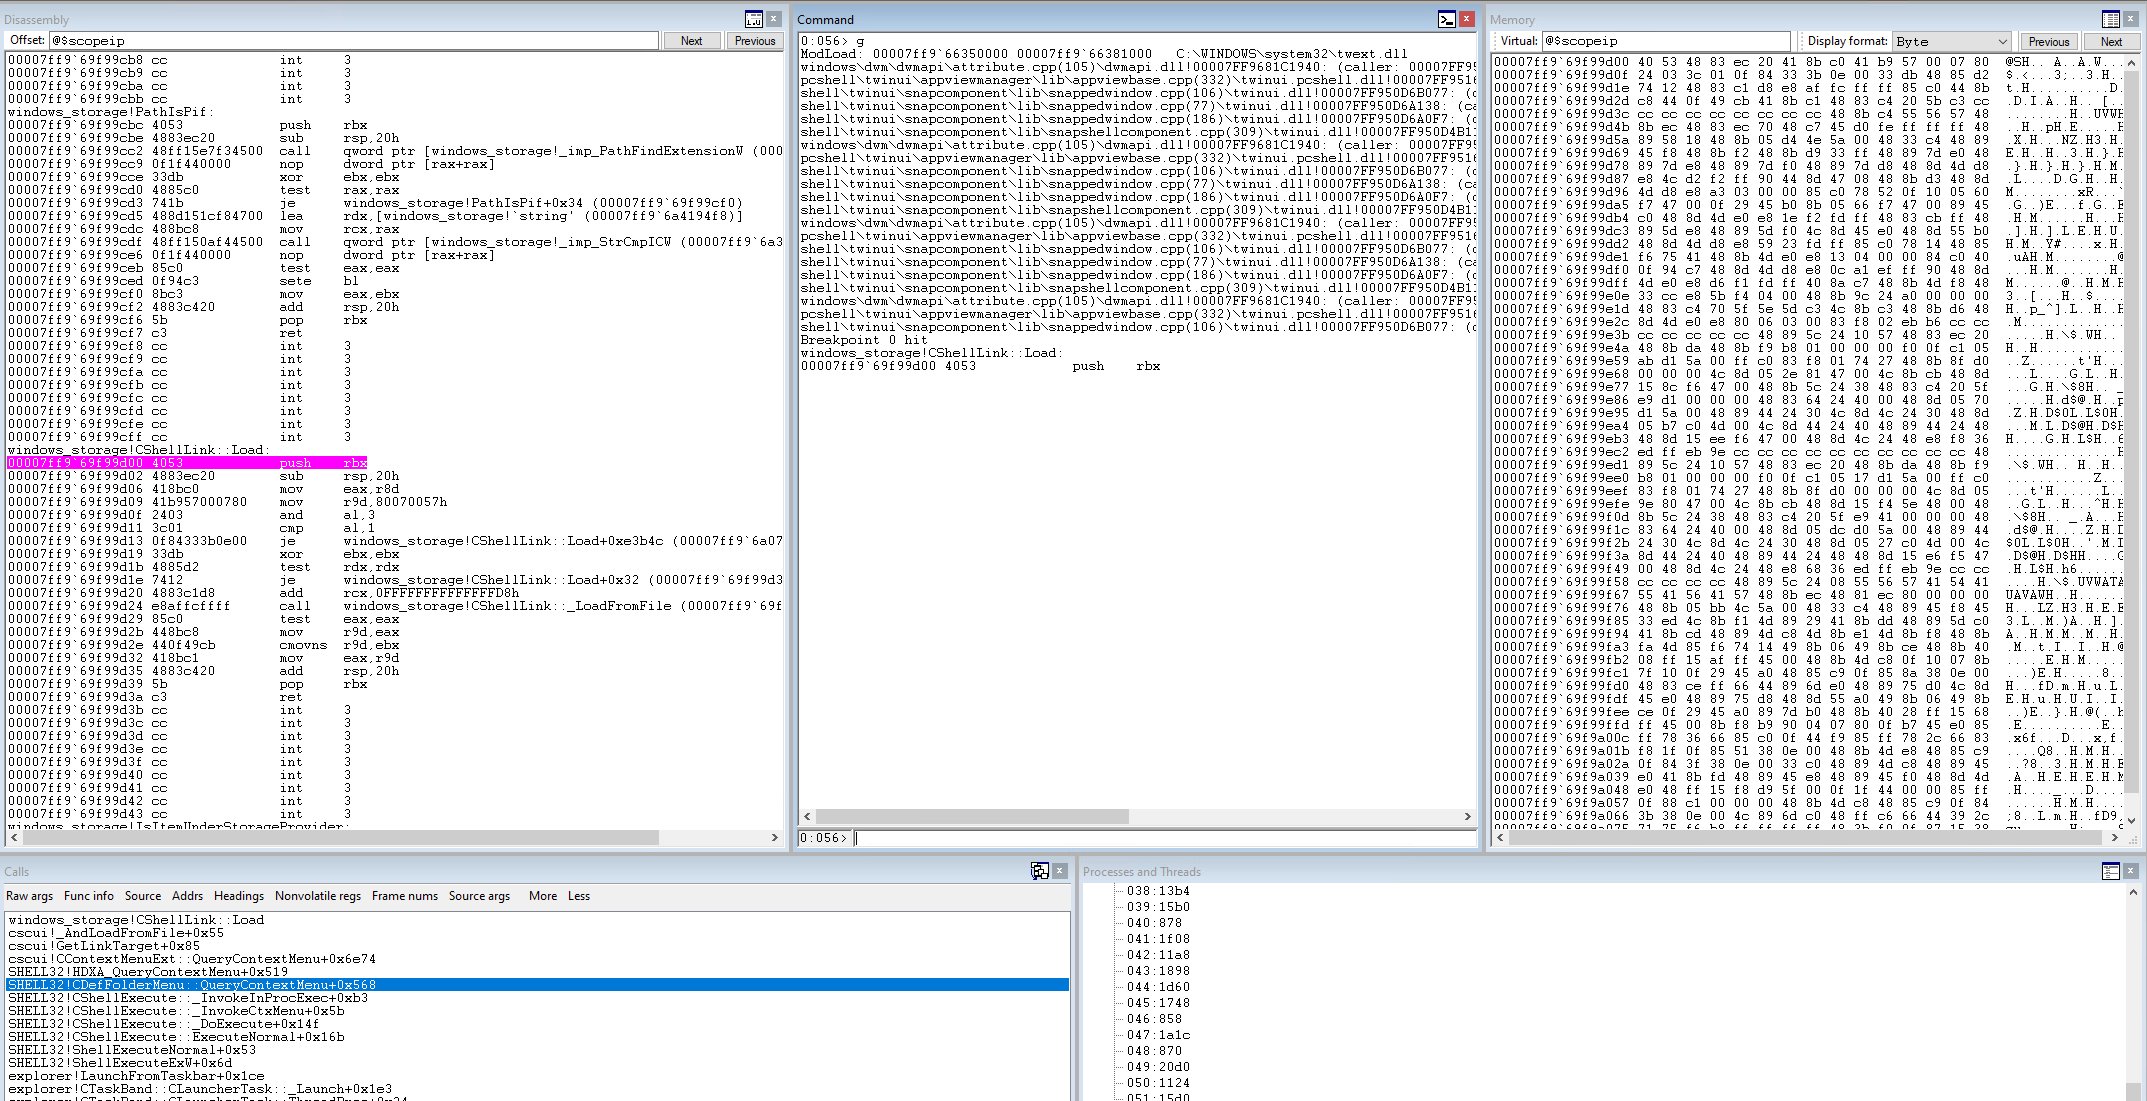
Now that we've set our breakpoint, let's have explorer continue executing until we hit a breakpoint by using the "Go" command. You can do this with the g command in the command window, the F5 key, or by clicking the button:

Likely, you'll hit the breakpoint almost immediately. If not, just try to open the start menu or an explorer window. When the breakpoint is triggered, you'll see Breakpoint # hit followed by the location and the current assembly instruction. You'll also notice the Disassembly window is showing the start of the function, and the Call stack window shows all the in-progress function calls that led to our breakpoint.
Memory window (and processor breakpoints)
Let's take this opportunity to have a look at the memory window by taking a quick look at what the addresses in the rdx and rcx registers are pointing to. We can do this by replacing @$scopeip with @rdx or @rcx.
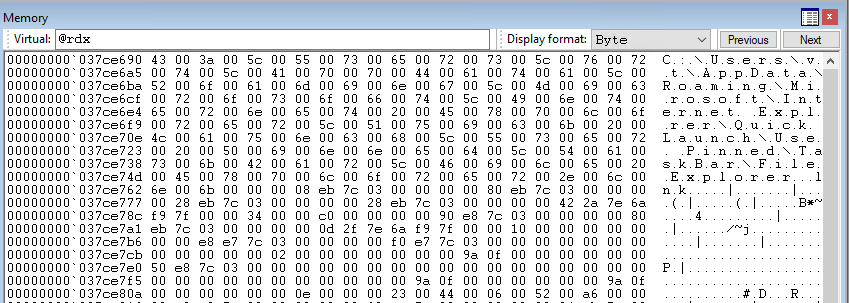
If we look at @rdx, chances are you'll see what looks like a path to a LNK file on the far right and you'll see the bytes corresponding to that wide character string. Byte values that correspond to ASCII characters will be displayed as on the right like that when using the "Byte" display format, but it doesn't necessarily mean they're strings!
When we look at @rcx, the ASCII representation is just nonsense, and looking at the actual byte values we can realize quite quickly this isn't a string. So let's change the display format to Pointer and symbol which makes an attempt to interpet values as pointers to memory addresses and will apply symbols if the pointer corresponds to something like a function.
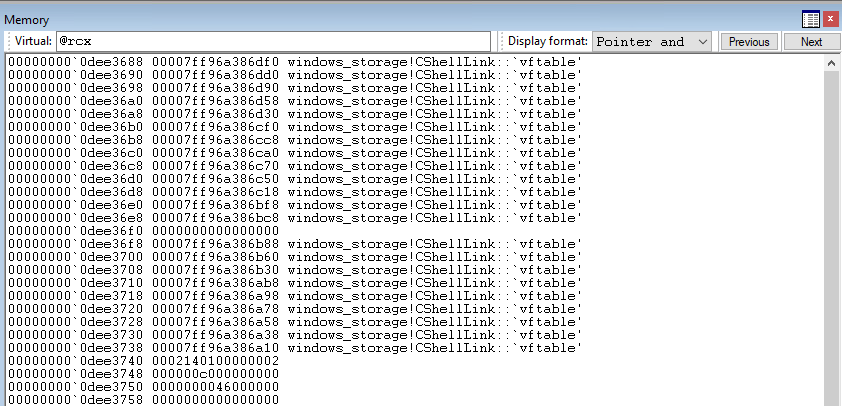
In this case, we see a bunch of references to windows_storage!CShellLink::`vftable` (virtual function table) which is usually a sign that you're inspecting some type of object, in this case, a CShellLink object.
In addition to using addresses in registers to inspect memory, we can also just put a memory address in there. Copy the address of the first pointer at rcx and paste it into the memory window.
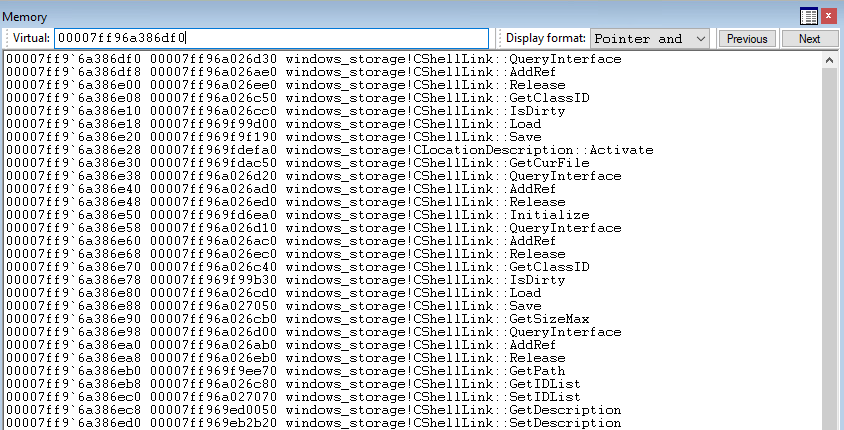
Now we can actually see a big list of functions contained in the virtual function table.
And really, that's about all you need to know about the memory window but if you'd like to dive deeper, check out the docs here: https://docs.microsoft.com/en-us/windows-hardware/drivers/debugger/memory-window
But wait... before we move on. Let's quickly talk about a slightly different type of breakpoint from what I already mentioned above: the processor or hardware breakpoint.
Instead of breaking at a particular instruction, processor breakpoints will pause the program execution when a particular memory address is accessed. This is tremendously handy if you want to know where a value stored in memory gets used or modified.
To set a processor breakpoint use the ba command in the command window. The ba command requires that you specify the type of memory access (read, write, or execute), the size of the location to monitor for access (1, 2, 4, or 8 bytes on x64) and the address. So if we wanted to see the next time that string pointed to by @rdx gets accessed, we would use the following command:
ba r 2 @rdx
If you check the breakpoint using bl you'll see it shows the address as well as the access type and monitored size. If we hit go, we'll hit that breakpoint (probably) in KERNELBASE!PathFindExtensionW().
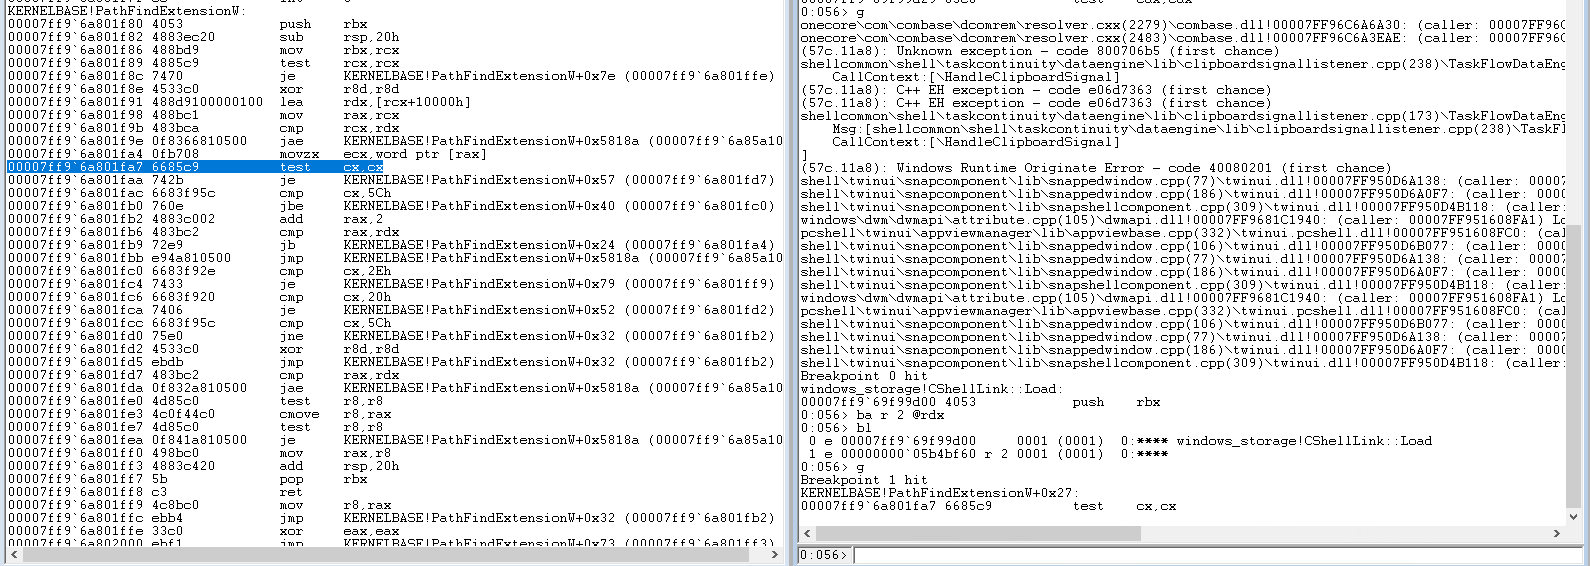
One thing you'll notice about processor breakpoints is that the instruction pointer will point to the instruction after the one that caused the memory access. Which makes sense, because the instruction had to execute in order to trigger the memory access and the processor breakpoint.
Get rid of that processor breakpoint with bc 1 (assuming you haven't set any other breakpoints) and hit go so we're back at the beginning of another call to CShellLink::Load().
Controlling execution flow
WinDbg includes the 3 standard step functions that I mentioned all debuggers tend to have.
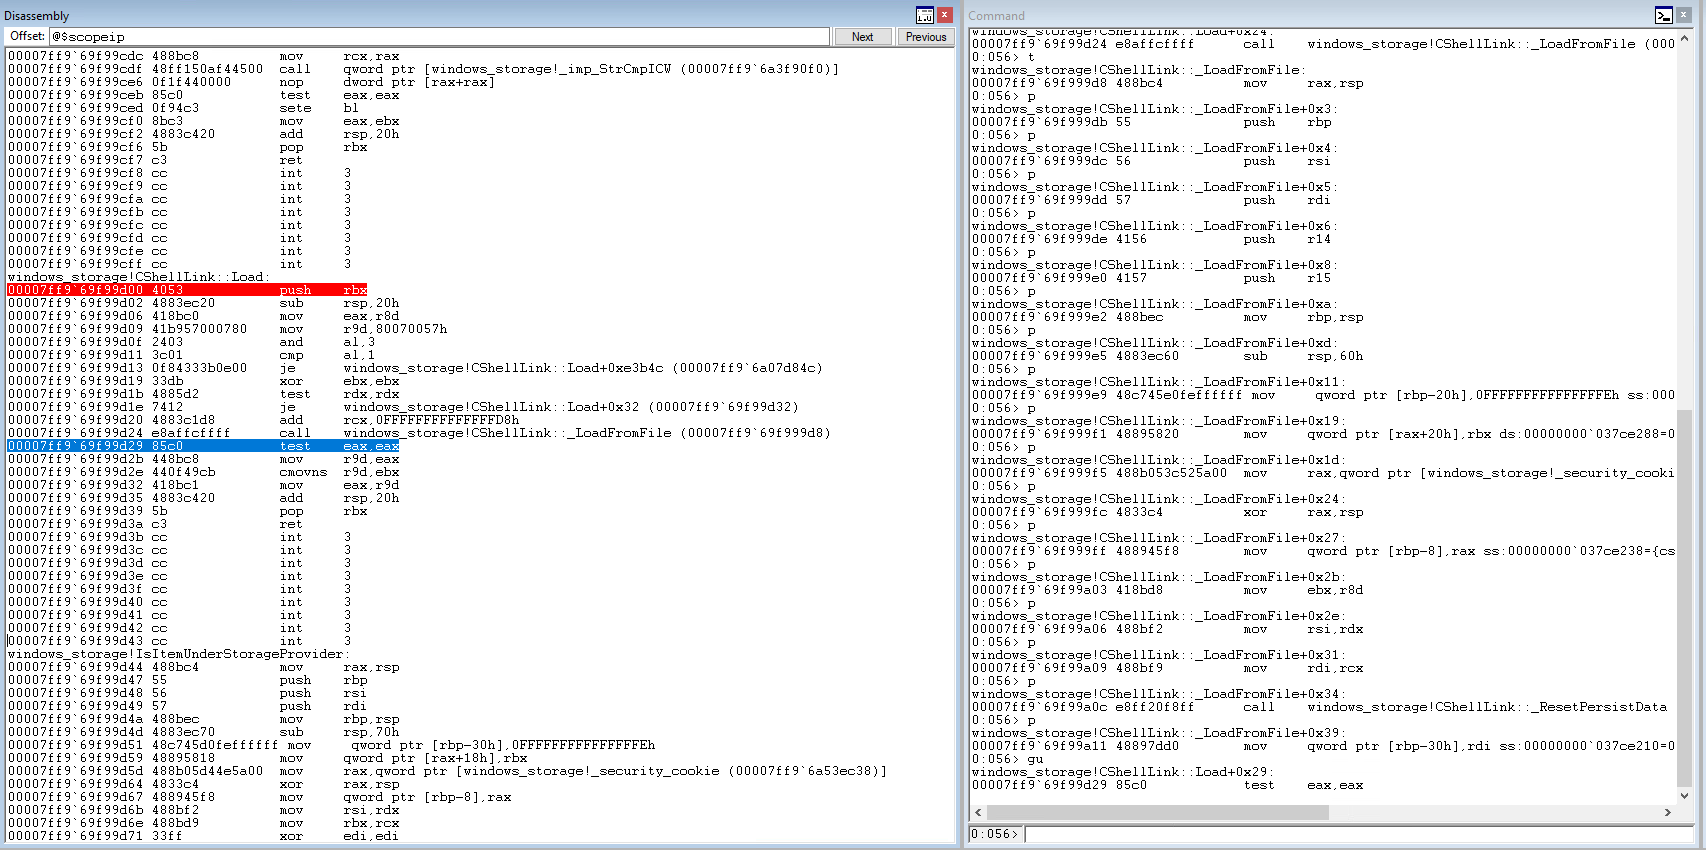
Step into is performed by using the F8 or F11 key, the t (trace) command in the command window, or by clicking the button with the arrow going inside the curly braces {}. Each time you step you'll see the current offset in the function printed out along with the next instruction that will execute. Let's press step into until we're about to execute that je instruction at an offset of 0x13 in the function.
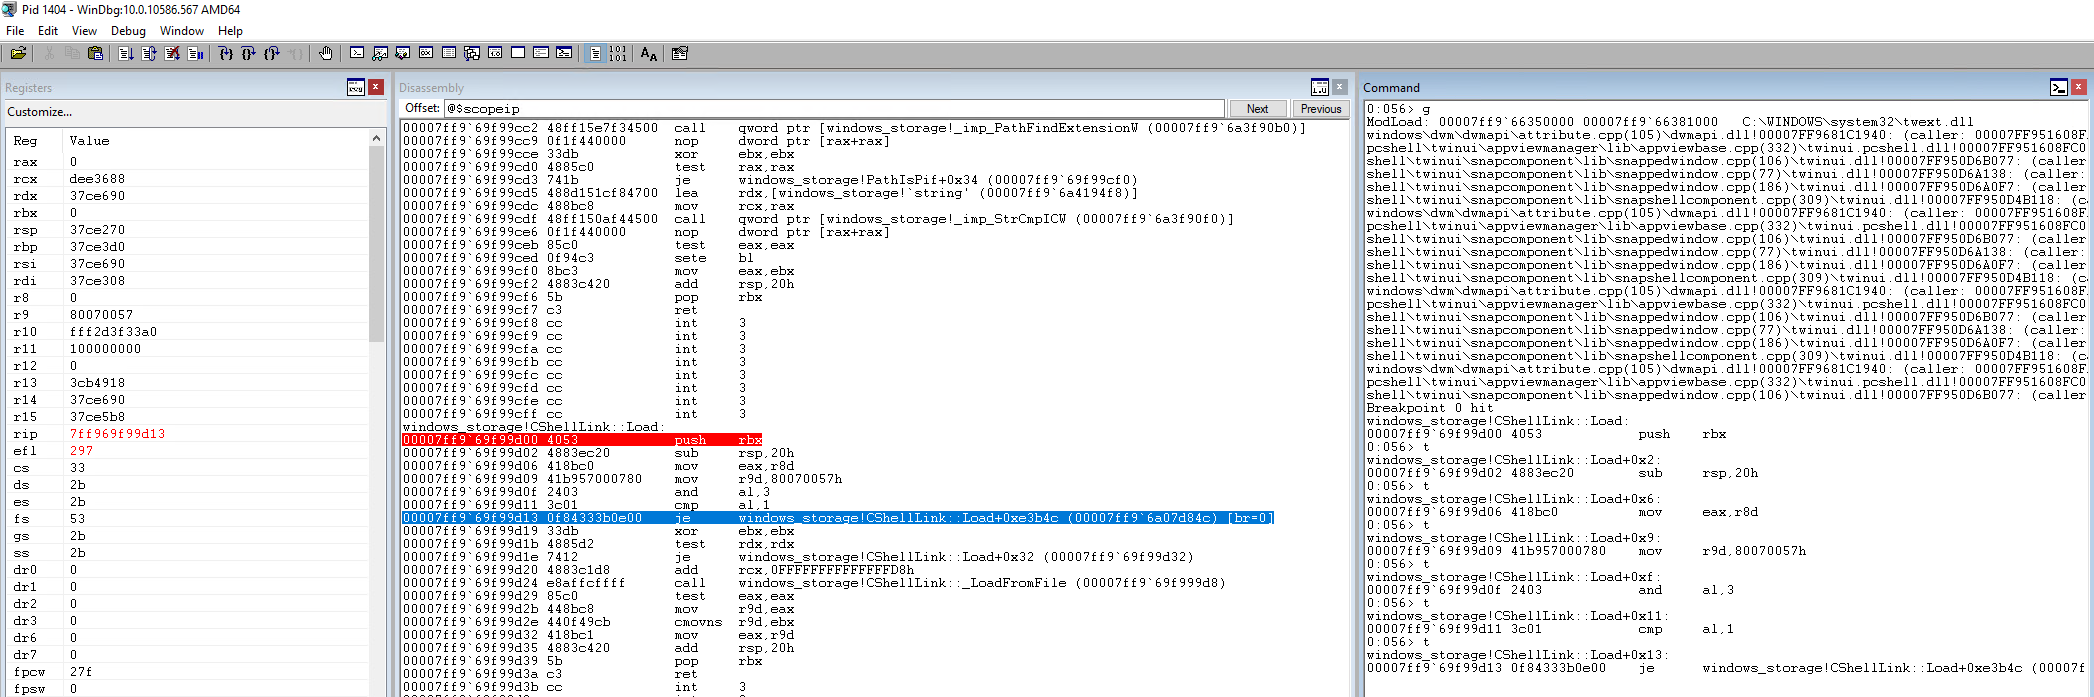
Have a look at the disassembly window in the screenshot. The red highlight is where we have our breakpoint set, and the blue highlight is the next instruction that will be executed. Because this is a conditional jump instruction, WinDbg actually tells us ahead of time if we're going to take the jump or not with the [br=#] to the right of the jump address. A value of 0 means no jump, and a value of 1 means the jump will happen. Now let's continue stepping in until we enter the CShellLink::_LoadFromFile() function.
Now let's start using Step over. You can use F10, the p command in the command window, or the button with the arrow going over top of the curly braces {}. Keep stepping and you'll eventually come to a function call for CShellLink::_ResetPersistData. Step over one more time and you'll notice you just went right past that function call, executing everything inside that function in the process.
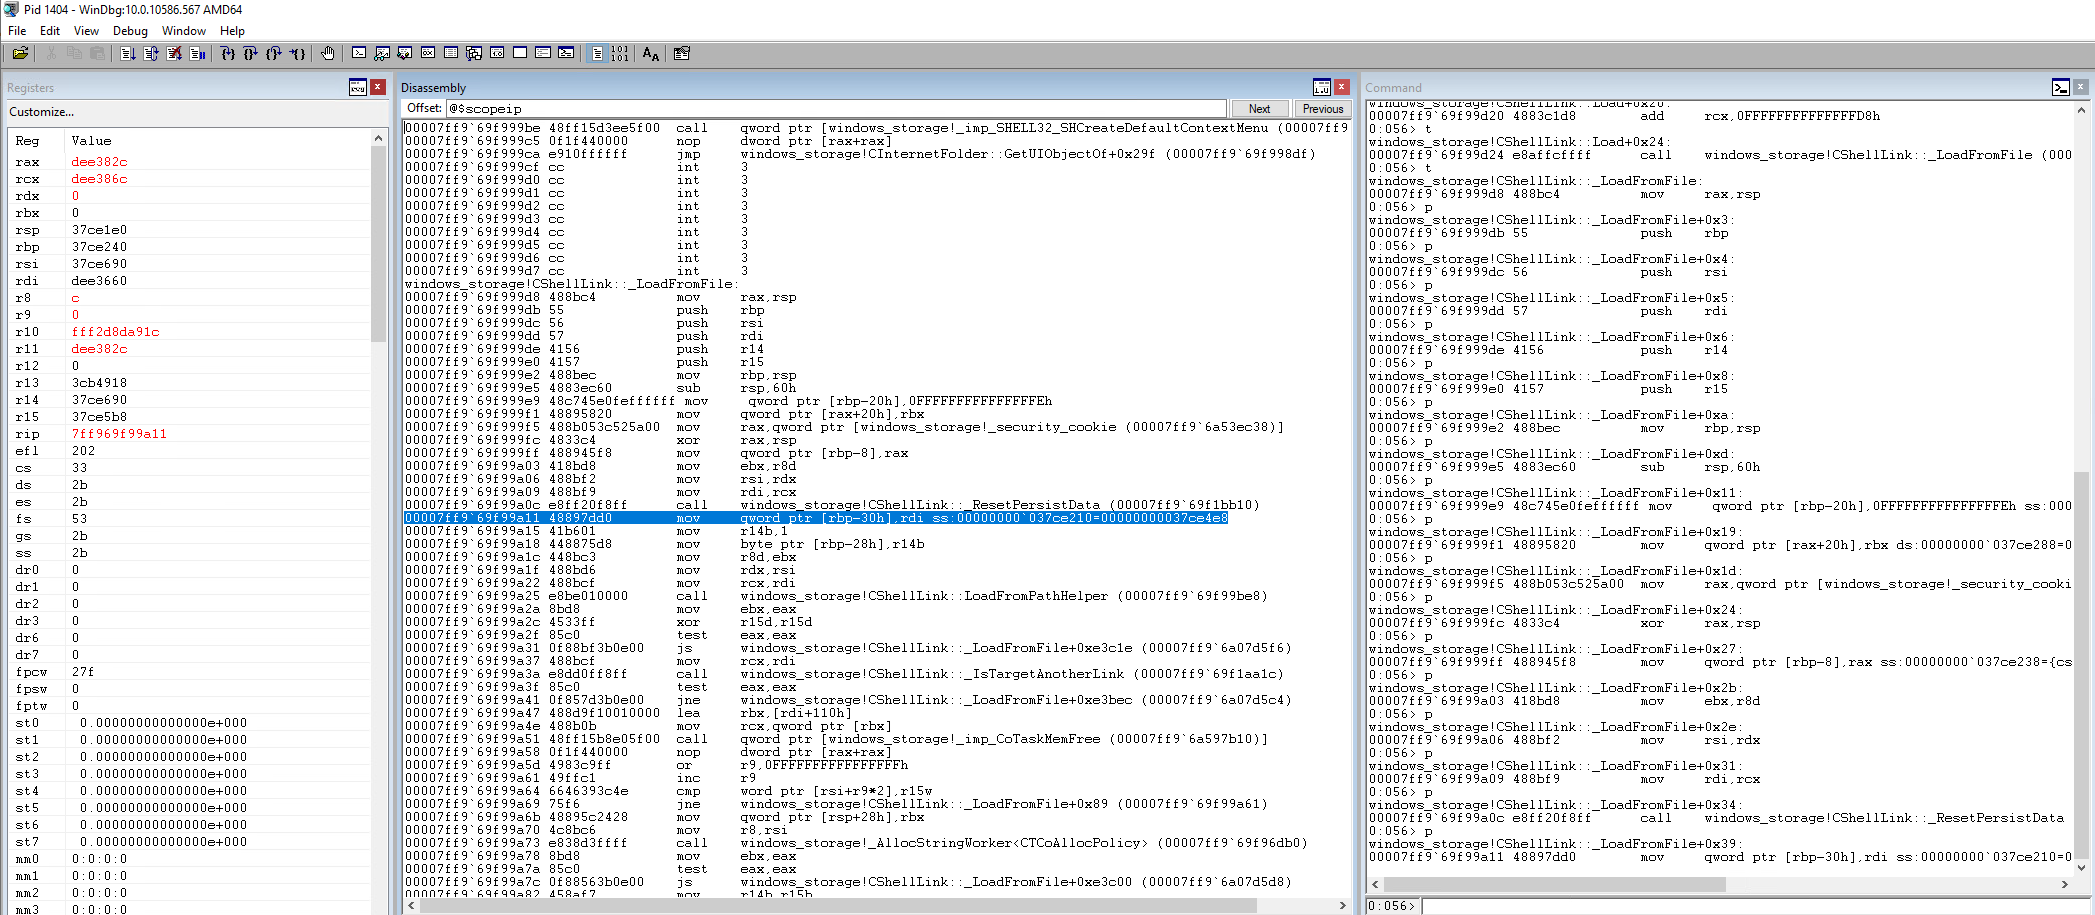
Notice in the register window that several of the register values are highlighted in red. This means that the values have changed since the last instruction we stopped on and in this case, we have a bit of an idea of things that may have changed as a result of the function call we skipped over.
Finally, let's use step out. You can use Shift+F11, the gu (go up) command, or the button with the arrow exiting from inside the curly braces {}. This immediately gets us back to CShellLink::Load(), treating the rest of CShellLink::_LoadFromFile() as if we skipped over it in the first place.
WinDbg also has a "run to cursor" function which can be especially handy if you're stuck in a loop that repeats a LOT and you just want to get past it. Simply double click the location you want to run to in the assembly window, then hit Control-F10 or F7 or hit the button with the arrow pointing to the curly braces ->{}.
There are a lot of other ways to control the program flow, but these are the core ones you'll use all the time. Again, I encourage you to check the documentation https://docs.microsoft.com/en-us/windows-hardware/drivers/debugger/controlling-the-target for the full list.
Believe it or not, everything I've just introduced above covers probably 90% of how I use WinDbg during my research. Does this mean I couldn't speed up or automate tasks using some of the more advanced functionality? Of course not, but most of the time you can get by with just the basics.
Debugging most local processes can be done just like we have with explorer.exe. But what if you want to debug something that will really hose the system if it stops, like the Local Security Authority (lsass.exe) or maybe you don't want to have WinDbg on the same system as a stopped explorer.exe process. Maybe you'd even like to debug part of the kernel or a driver? This can all be achieved with remote debugging.
Remote and Kernel Debugging
Let's first talk about remote debugging with WinDbg for standard processes. This is tremendously handy if you’re debugging a process that makes the system unstable or unusable when program execution is paused, such as the Local Security Authority (lsass.exe) or oh, I don’t know… explorer.exe?
For this you will probably want to use a virtual machine but it’s not mandatory as you can just connect to localhost instead of a remote IP to at least get yourself familiar with the process. Both the system running the process you want to debug and the system you’re using to debug will need to have the Debugging Tools for Windows from the SDK installed.
There’s a couple different ways of remotely debugging a process. You can create a debug server directly from within WinDbg but this generally requires that you attach to a specific process or launch an executable. My personal preference is to use the process server which allows you to view the running processes on the remote machine and attach to a process or execute a new process on the remote system (if you specify it on the command line when starting the debugging client, or are using WinDbg Preview, which I’ll talk about a bit later). The reason I prefer this method is that when I am causing a research target to crash (intentionally) such as the DNS server on Windows Server, I like not needing to restart the debug server or reconnect the debugging client.
Debugging a standard process remotely
The first step is to start the debug server on the target system. Locate where WinDbg is installed, typically Program Files (x86)/Windows Kits/10/Debuggers/x64/, then open up a command prompt with administrator privileges. To start the process server run the following command:
dbgsrv.exe -t tcp:port=<port number>,password=<password>
As a side note, communication using this method is unencrypted, including transmission of the password. If this isn’t acceptable for you, you can use SSL/TLS but you’ll need to have a server certificate in the local certificate store. Then you can run dbgsrv with the following:
dbgsrv.exe -t ssl:proto=tls1,certuser=<cert name or fingerprint>,port=<port number>,password=<password>
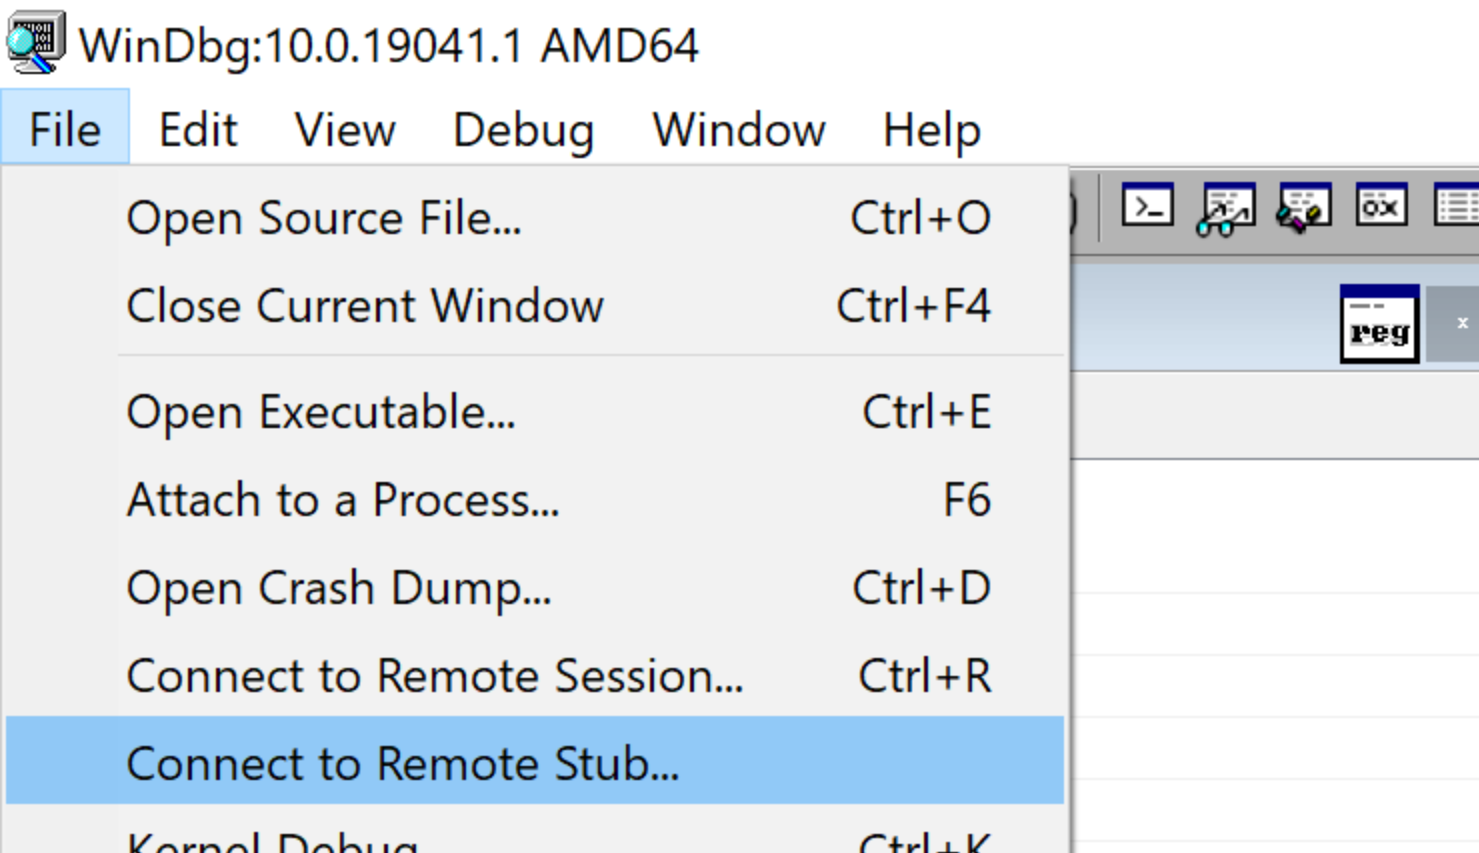
Once it’s running, you can connect to the process server by going to File/Connect to Remote Stub
Then for the connection string if you are using the plain tcp connection use the following:
tcp:port=<port number>,Server=<target IP>,password=<password>
If you're using SSL/TLS, you'll use the exact same -t ssl: parameter you used to start the server, just add Server=<target IP> in the same way as for the plain TCP server.
If you successfully connect it will appear as if nothing has happened, which is admittedly less than helpful. However, if you go to File/Attach to a Process and look through the process list, you are actually looking at the processes on the remote system. If you want to be 100% certain, open up task manager in your machine running WinDbg and check the PID of any unique Windows processes like csrss or lsass against the PID you see for those same processes in the Attach to Process window. (Of course, if you're doing all of this on the same system this check doesn't apply).
Now you can just debug as usual! When you're done debugging, don't forget to shut down dbgsrv.
Kernel debugging
Before I talk about kernel debugging I'll just note that this KDNET method is only supported on target machines running Windows 8 or later. Also, for the most part these are really just the instructions provided by Microsoft here: https://docs.microsoft.com/en-us/windows-hardware/drivers/debugger/setting-up-a-network-debugging-connection-automatically
First off, to make life a bit easier, copy kdnet.exe and VerifiedNICList.xml from C:\Program Files (x86)\Windows Kits\10\Debuggers\x64 (or wherever you have the debugging tools installed) to C:\KDNET or some other easy to access directory. Also, if you don't have the Windows Debugging Tools installed on that VM, you can just copy those two files over from another system instead of installing everything from the SDK.
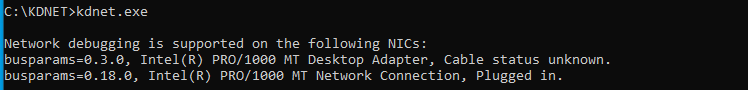
Next, open an administrator command prompt, go to the directory where you placed kdnet, and run kdnet.exe without any arguments. You should see something like this:
Or if you’re running in a Hyper-V VM, you may only see this:
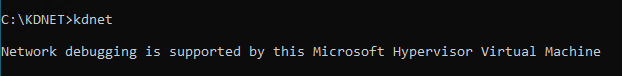
In the first image you can see kdnet is showing two network adapters, one with cable status unknown and one showing Plugged in. In my case, I have no idea what that first adapter is but it's not the correct one. By default, KDNET will use the first adapter that shows up in that list, regardless of whether it's correct or not. If you only have one adapter show up, you’re running in Hyper-V, or the first adapter is correct you can just run the following:
kdnet.exe <debugger host> <debugger port>
Unlike using the process server, KDNET will connect back to your debugger as opposed to having your debugger connect to KDNET, so make sure the port you've specified is accessible on your system running WinDbg.
If you need to specify a particular adapter, you'll need to use the /busparams argment to specify the correct adapter. In my case, I run the following to use the 2nd adapter:
kdnet.exe /busparams 0.18.0 <debugger host> <debugger port>
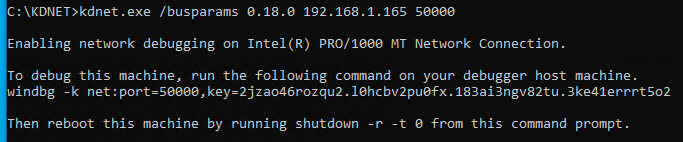
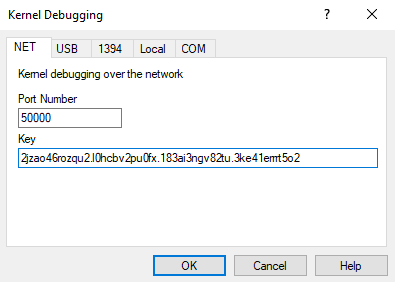
In either case, once kernel debugging has been enabled, KDNET will provide a command line to start windbg from the command line for kernel debugging. You can also just take the key and port and go to File/Kernel Debug in WinDbg then enter your port number and the key provided by KDNET.
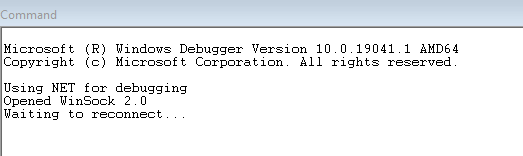
Once you click OK you'll see something like this in the command window:
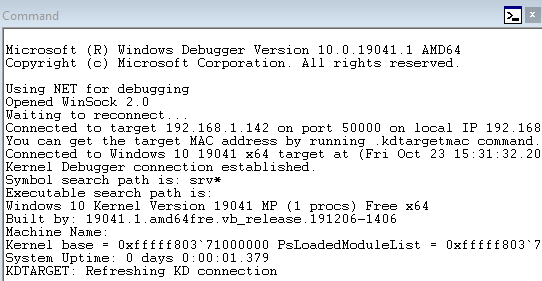
Now you can go to the target machine and reboot it. If everything goes right, you’ll see the debugger connect:
In order to set a breakpoint, you may need to hit break, either by hitting the button with the pause symbol or by hitting Control-Break. Now, if you’re interested in debugging a driver, you can just set a breakpoint as usual, using the driver name as the module name (tcpip.sys for example will be tcpip). However, you might also want to debug a system call from within an application. To do that, we first need to get the address of the process we want. We can use the command !process 0 0 which will show us information about all the processes, but there’s usually a lot of processes and you probably have an idea of the process you’d like to focus on. All we need to do is add the process name to the end of the command I just mentioned. For example, here’s what we get for explorer.exe:
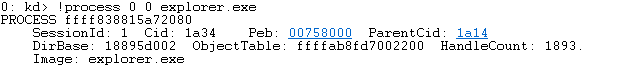
In this case, the process is at ffff838815a72080. In order to change the process context so we can debug system calls made from explorer, we use the .process meta command with the /i, /p and /r flags, followed by the process address.
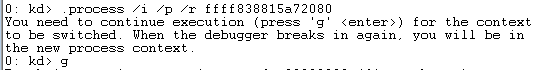
You may or may not notice that the loading of the debug symbols gets deferred. This is because downloading and loading all the symbols takes a LONG time if this is the first time debugging or you’ve done a substantial amount of updates since the last time. You’ll want to force loading of all the debug symbols, and you can do so with .reload /f, then go make a coffee or tea if you haven’t done it before as this will take a while. Once that’s done, you can now easily set a breakpoint in explorer just like before. Try it with CShellLink::Load() like before. It’ll behave similarly, but if you hit a system call you’ll actually be able to debug it.
There’s lots more to kernel debugging but again, these are all the basics you need for the vast majority of situations.
Time Travel Debugging with WinDbg Preview
WinDbg Preview is an updated version of WinDbg that’s available only through the Microsoft App Store at the moment. While it is still a bit rough around the edges and occasionally sees some regressions, it has an updated and more friendly UI but all the visual changes pale in comparison to what is, in my opinion, the most important new feature in a free reverse engineering related tool in many many years; time travel debugging.
Time travel debugging (TTD) allows you to “record” execution of a program then replay it. This on its own would be somewhat helpful, as things like memory allocations will change between different executions of the same application, but the added TTD functions are what makes this amazing.
First, instead of just stepping forward in some manner through the program, we can step backwards(!) and execute backwards to hit breakpoints on code that was already executed. Second, the WinDbg team added a timeline feature which allows us to visually see function calls, breakpoints, and memory accesses through the lifetime of the program. Between these two features, WinDbg becomes ridiculously powerful when it comes to tracing the flow of data through an application. So without further ado, let’s dive right in and record our first trace.
Recording a trace
Recording program execution with WinDbg preview has a couple caveats. You have to run WinDbg as administrator and you can’t record a trace while remote debugging (as far as I know). Because of this, you’re limited to applications running on Windows 10 so Windows Server 2016 or 2019 are off the table unfortunately.
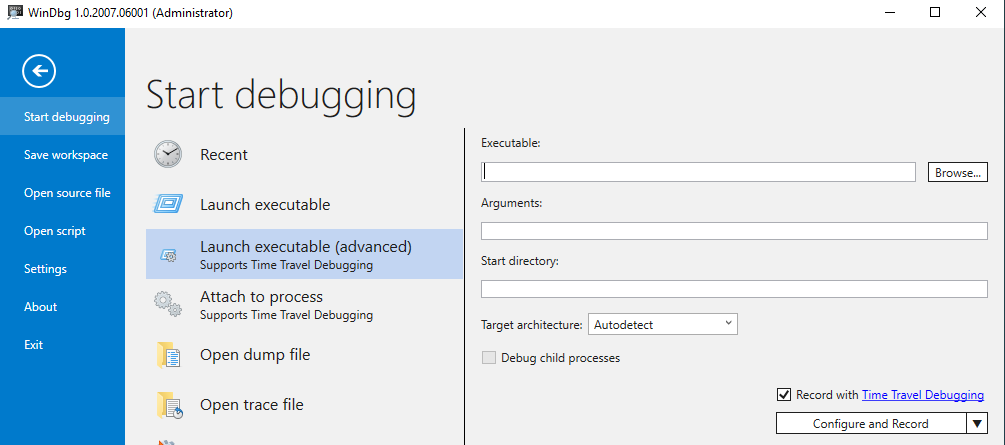
To start recording a trace, start WinDbg Preview as administrator, then go to File/Start Debugging and either Launch Executable (advanced) or Attach to Process. For either of these, all that’s needed is to check the Record with Time Travel Debugging box.
When it comes to recording with TTD, I always suggest recording the absolute minimum length of time you need. As a result, attaching to a process is preferable to executing a new process unless you absolutely need to see something (a function call or memory access) from the startup of the application. Also, when you attach to a process, you should have the application in what I call a “prepared” state for the functionality you’d like to record. For example, when I’m debugging LNK files in explorer I like to have my LNK file in a directory by itself and have an explorer window open with the folder selected (but not open yet). I start the recording, then open the folder containing the LNK file. This ensures I have a minimum number of LNK-related function calls in my trace and it will be easier to find what I want.
Let’s dive right in and attach to explorer.exe again, but this time we’ll record a session. Another thing to note here is that when you stop the recording, the process will be killed. In the case of explorer.exe this isn’t a huge deal as it will just restart after being stopped but just keep this in mind.
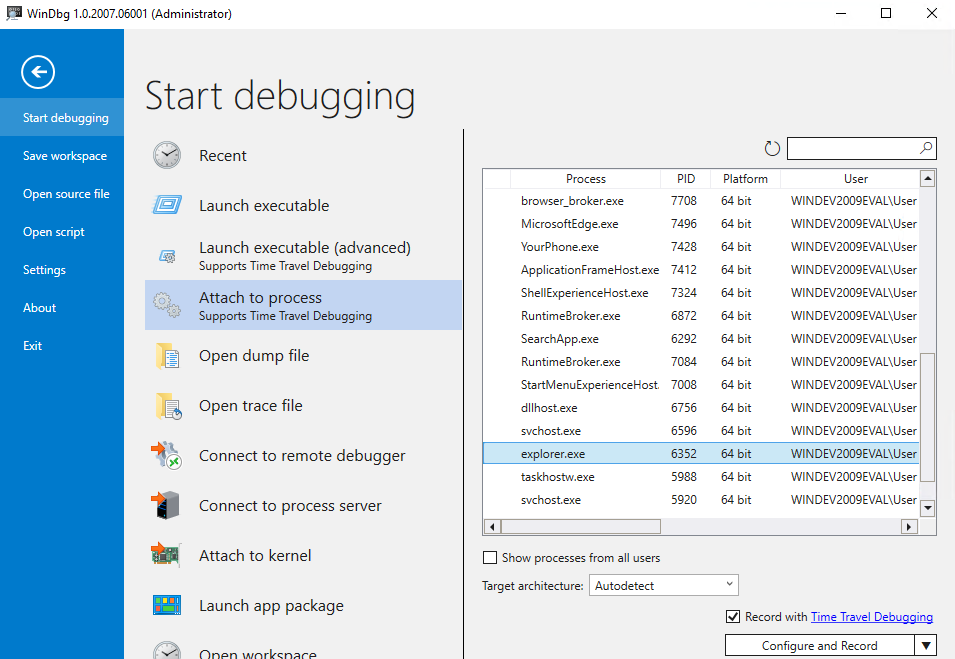
First let’s prepare our environment. Create a shortcut for something in an empty folder, then have an explorer window open displaying the parent folder. Now in WinDbg Preview go to File/Start Debugging/Attach to Process, select explorer.exe, check the Record with Time Travel Debugging box, then click configure and record.
You’ll be asked where to save the recording, then there will be a short initialization. Once it’s actively recording you’ll see the following dialog:
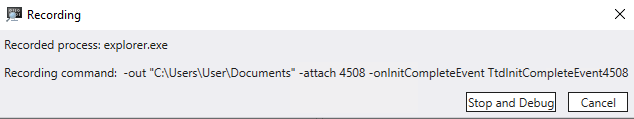
Now, go to your open explorer window and open the folder containing your LNK file. You may notice things are a little less responsive and things take longer to load. This is normal and expected when recording a TTD trace. Once the folder is open and the icon for your shortcut file is displayed, switch back to WinDbg and press the Stop and Debug button. Explorer will be killed (and will restart) then the trace file will get loaded and indexed. Indexing for a complex application or a long recording will take a while but in this case it should be fairly fast.
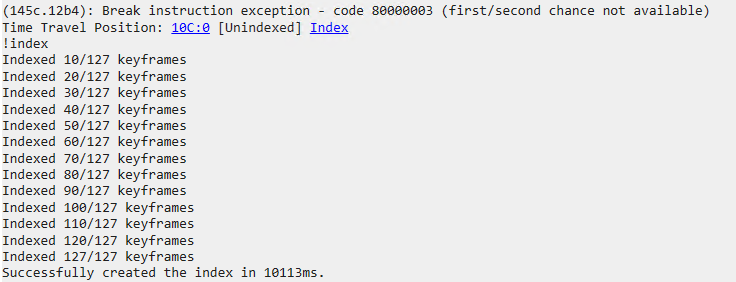
Once the indexing is complete you’ll be looking at something like this, noting that this is the default window layout and not what I typically use:
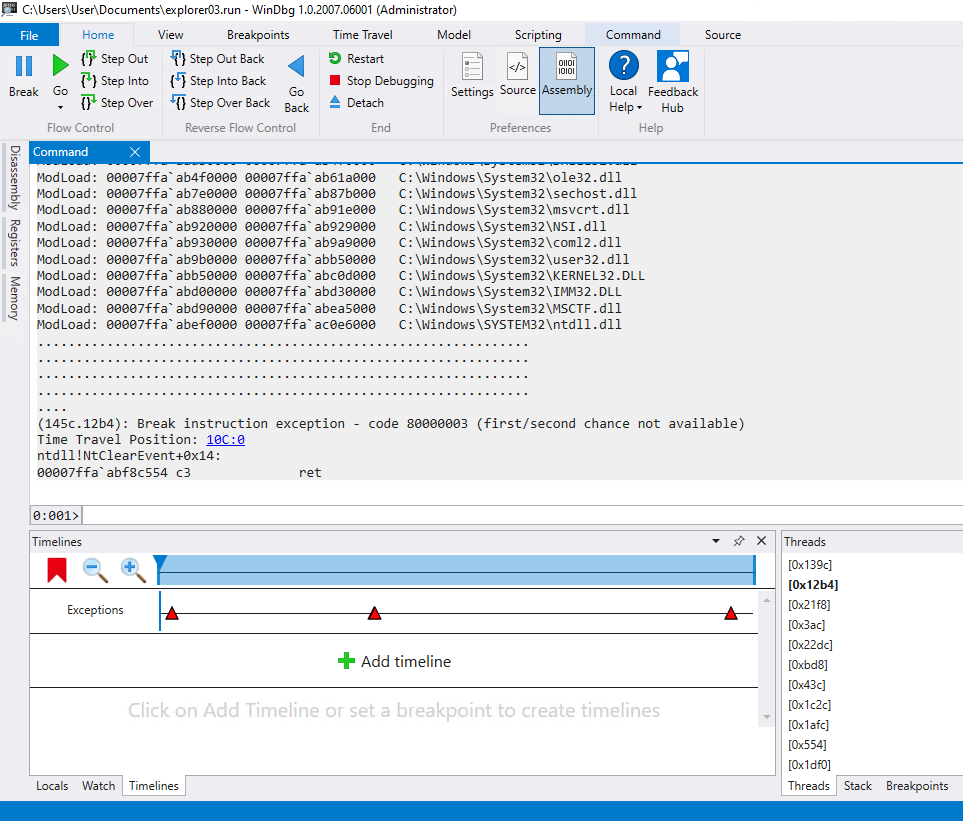
The main things to note here are the new Reverse flow control buttons in the Home ribbon at the top of the window, and the Timelines tab in the bottom dock window.
The Reverse flow control operates just like normal flow control, but in reverse. When you use Step into back and the previous instruction you’re seeing is a function call, you’ll step into the last instruction of that function call. With Step over back you’ll jump to the instruction where the function is actually called, and with Step out back you’ll step out of the current function call to the instruction where that function was called. Finally, you can use Go Back to “execute” the program in reverse, which will take you to breakpoints you may have passed already, or the start of the trace recording.
Timelines
By default, the Timelines tab will show all exceptions present in the recording, noting that this includes handled exceptions. Similar to our initial look at WinDbg classic, let’s set a breakpoint at windows_storage!CShellLink::Load.
Now what should happen is that all breakpoint hits will show up as dots in the Timelines window. However, at the time of writing (October 2020) for the last couple WinDbg Preview releases (emphasis on “Preview”) I have been unable to get breakpoint timelines to work at all and you will just see the timeline item for the breakpoint stuck in a “loading” state:
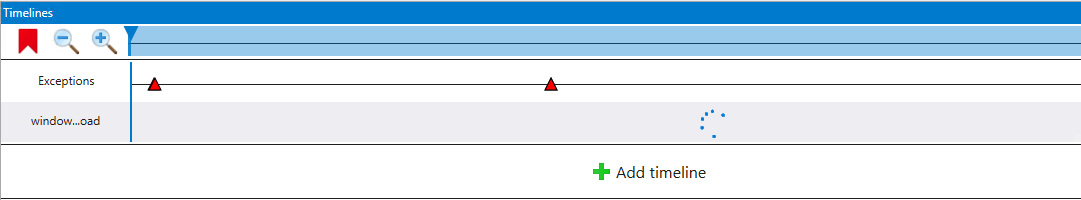
For now, if you find the constant loading spinner annoying, you can just remove that timeline item by moving your mouse over the name of the timeline item then clicking the “X”.
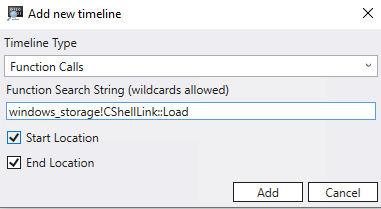
Breakpoints themselves still function perfectly fine, so we can hit “Go” as usual to reach our first breakpoint hit. You’ll see the timeline marker shift to where the breakpoint hit is in the context of your entire recording. Even though breakpoint timelines aren’t functioning properly, we can still add a Function timeline which will show us the start and end of the function call. Let’s click Add timeline and add a function call timeline for windows_storage!CShellLink::Load:
Now you should be able to see the green arrows denoting the start and end of the function calls. If you can’t see it very well, use the zoom controls in the timeline window to zoom in on the area of the timeline you’re interested in:
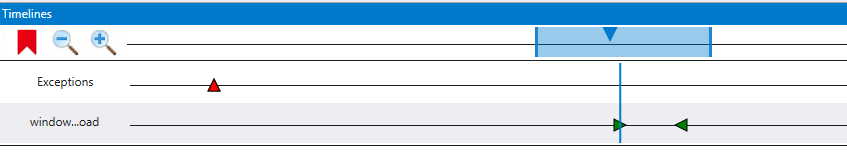
One of the best parts about timelines is you can simply click on any timeline item and WinDbg will jump right to that location in the recording and let you debug from that point. For example, you can get right to the end of the CShellLink::Load() call by clicking the <| in the timeline and go right back to the start of the call by clicking the |> or hitting “Go back” to hit the breakpoint.
If you watch the command window, you’ll see that most of what you’re doing corresponds to WinDbg commands, and as you jump around or step through instructions you’ll see the “Time Travel Position” address change.
WinDbg Preview does technically have a Bookmark feature so you can keep track of different positions but I also haven’t been able to get it functioning so I’m not going to cover it. However, you can save positions of interest to your favourite text editor (or the built in notes window in WinDbg) then use the !ttdext.tt command with the position which may look something like !ttdext.tt 67780:227.
Finally, remember the processor breakpoints we talked about for stopping a program on memory access? Well we can set memory access timelines to get an even better idea of where those accesses take place. Unfortunately, the current version of WinDbg Preview also seems to have broken memory access timelines so you will tend to see this after adding one:
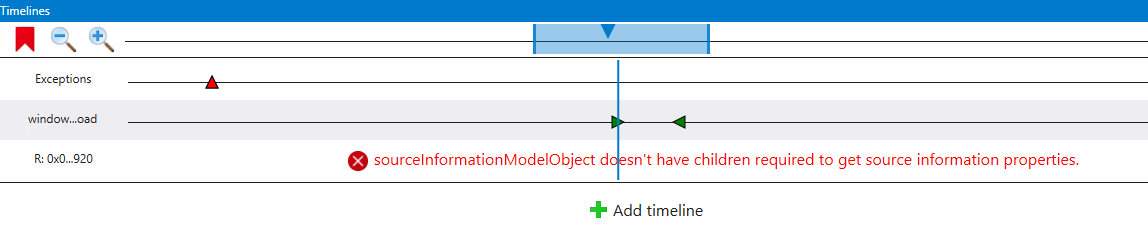
Once these bugs are resolved, I’ll come back and update this post to add a bit more detail on memory timelines.
WinDbg closing notes
WinDbg has an insane amount of functionality, but the purpose of everything I’ve provided here is to give you an overview of the basics. If you are interested in learning more, here’s the primary resources I tend to use:
- WinDbg documentation from Microsoft (Includes WinDbg Preview) https://docs.microsoft.com/en-us/windows-hardware/drivers/debugger/
- windbg.info common command reference: http://windbg.info/doc/1-common-cmds.html
As always, don’t hesitate to give me feedback or ask questions on Twitter or Mastodon (links are top right of the page).